Map
 your
your
trading journey.
Visual trade mapping beats boring spreadsheets. Track emotions, spot patterns and improve your results.
v0.22.3 | macOS 14+
Trading Essentials
Manual processes slowing you down? Extract levels automatically, track emotions consistently, and stick to the plan.
- Level Extraction
Reduce data entry and bring chart analysis into your journal automatically.
- Emotion Tracking
Understand your psychology, spot destructive patterns, and build emotional strength.
- Strategy Checklists
Use checklists to follow your plan systematically and execute with confidence.
Visual Trade Journey
Map your complete trading journey on an interactive canvas. Drag, connect, and visualize every decision in the trade.
BTC
LONG2.5RAnalysis Paralysis
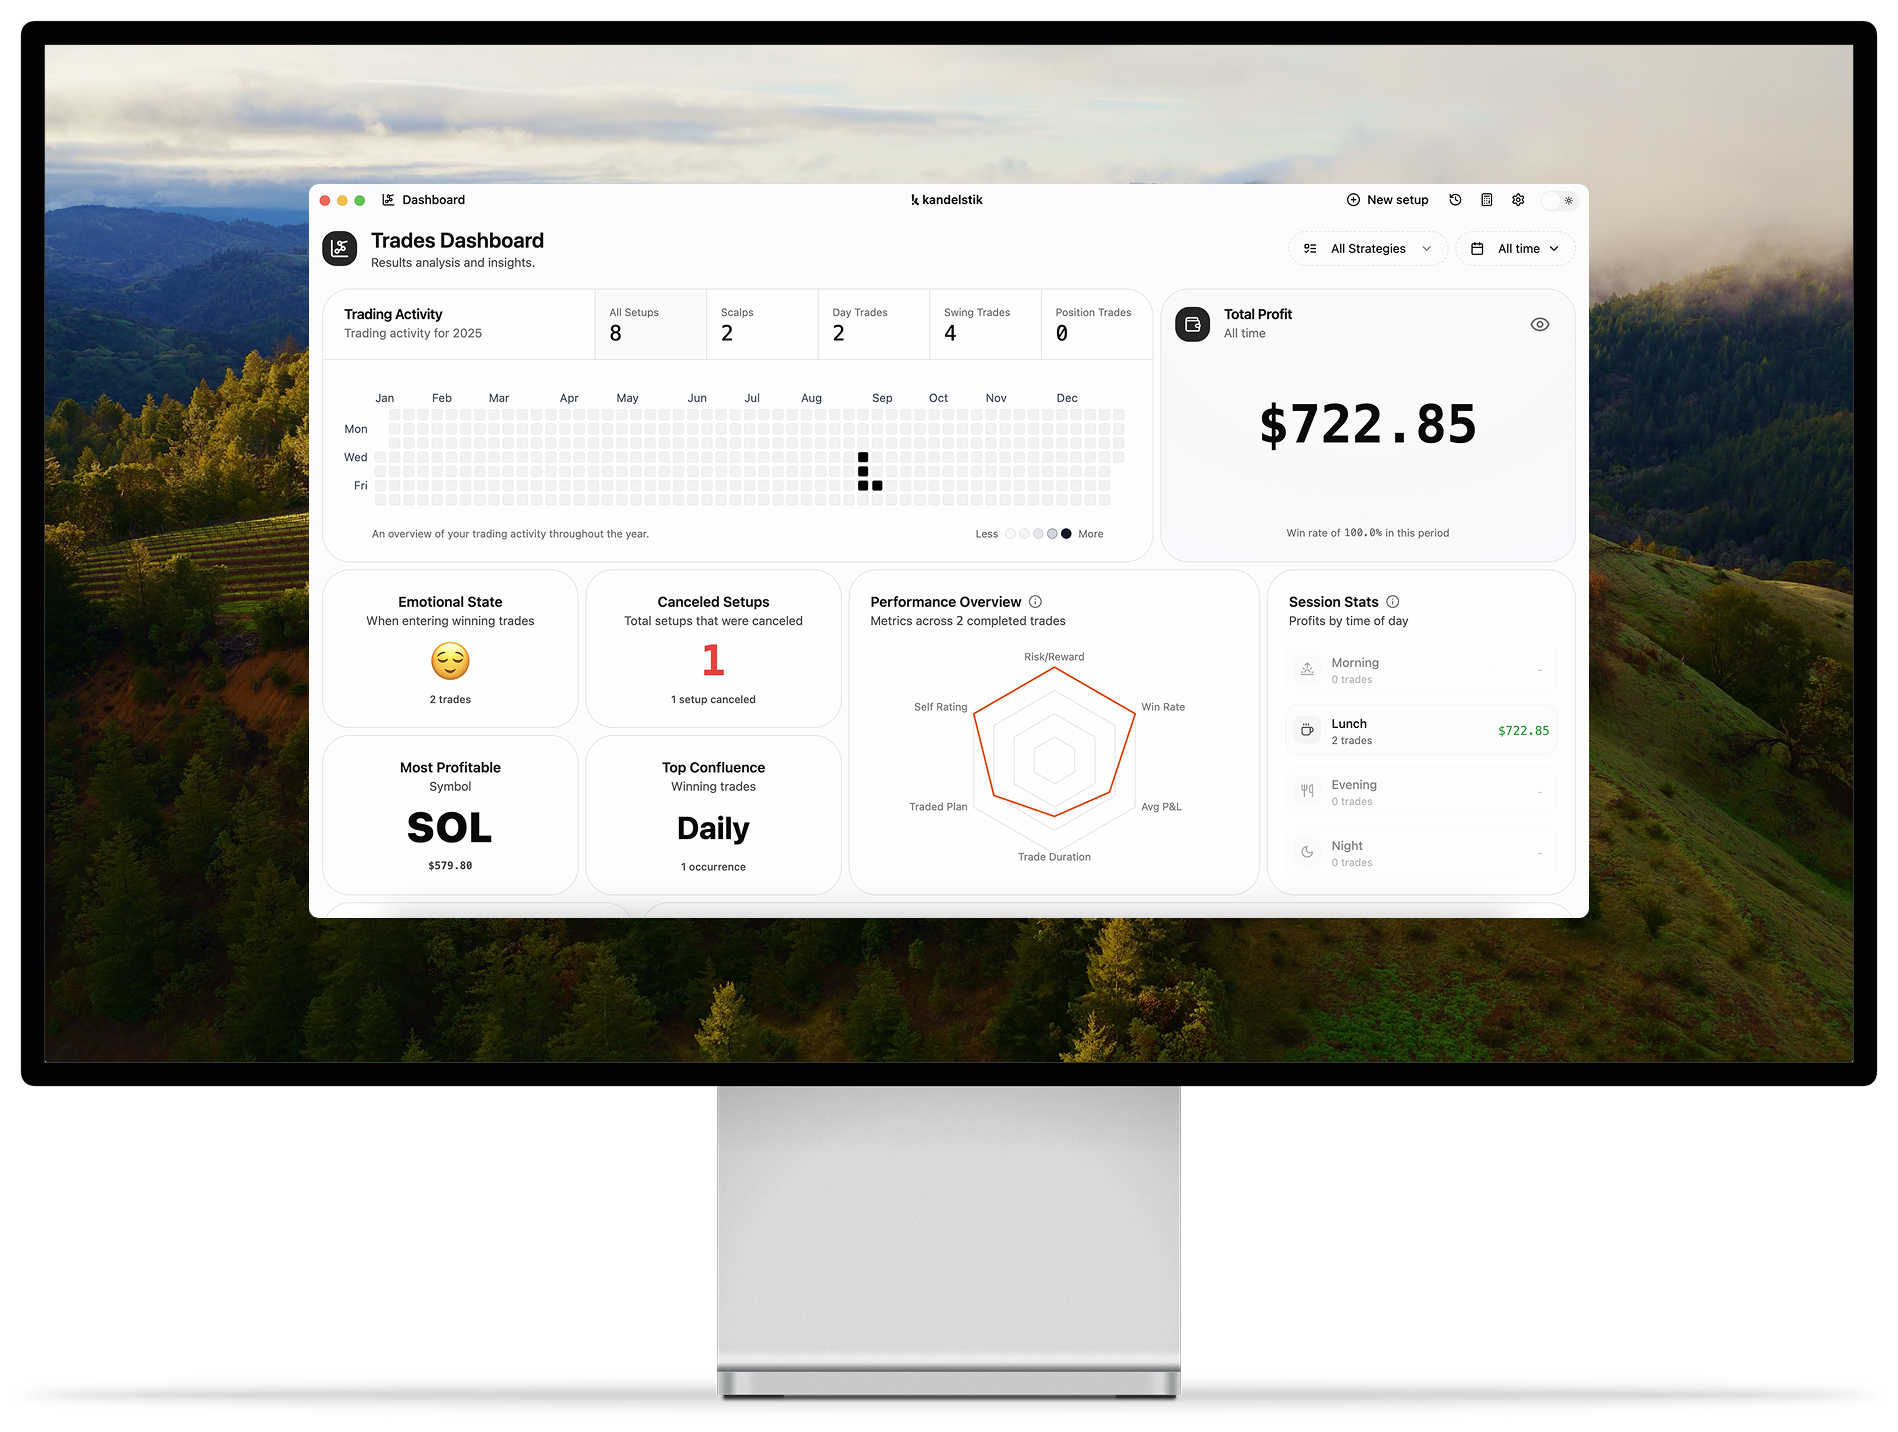
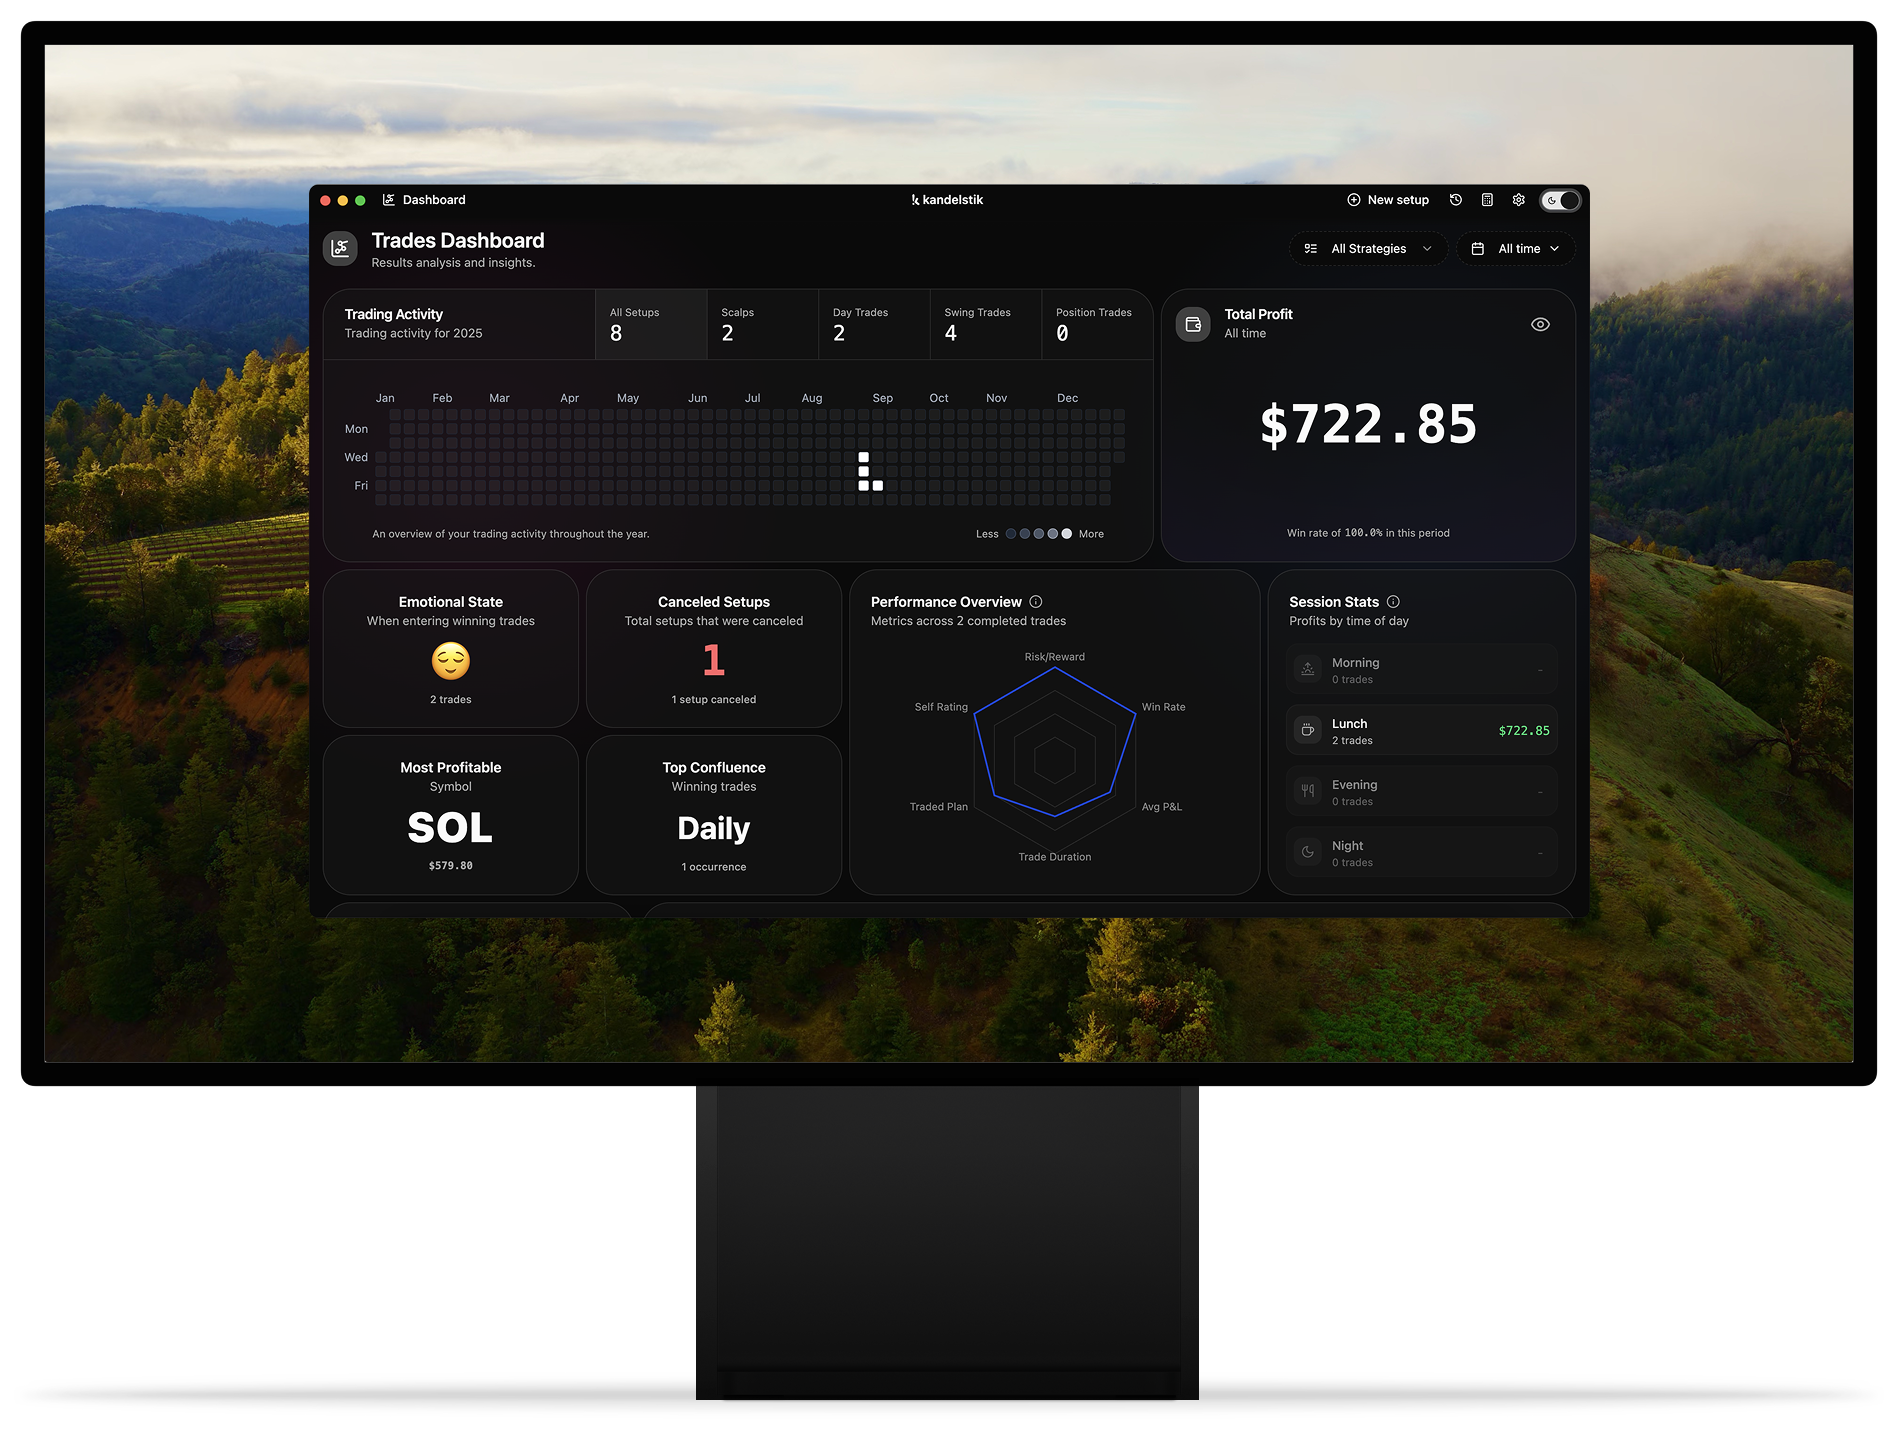
Lost in the numbers? Get clear insights that drive confident decisions.
Emotional State
In winning trades
Top Confluence
Winning trades
Most Profitable
Symbol
Canceled Setups
Total canceled
Visual Studies
Map out technical analysis concepts and trading strategies on canvas for better understanding.
* This diagram represents a sample study for illustrative purposes only and does not constitute financial or investment advice.
Who is this for?
Designed for struggling traders who want to get organized, collect data, and become profitable.
Simple Pricing
One-time purchase with lifetime access. No monthly subscriptions, no hidden fees.
One time payment
FAQ
Answers to common questions about Kandelstik.
Can't find what you're looking for? Contact our customer support team
Stay Updated with Product News
Get the latest updates on new features and product improvements delivered to your inbox.